Today · Jul 29, 2026
LVS Lost $87 Million to Bad Luck in Macau. The Volume Underneath Tells a Different Story.

LVS Lost $87 Million to Bad Luck in Macau. The Volume Underneath Tells a Different Story.

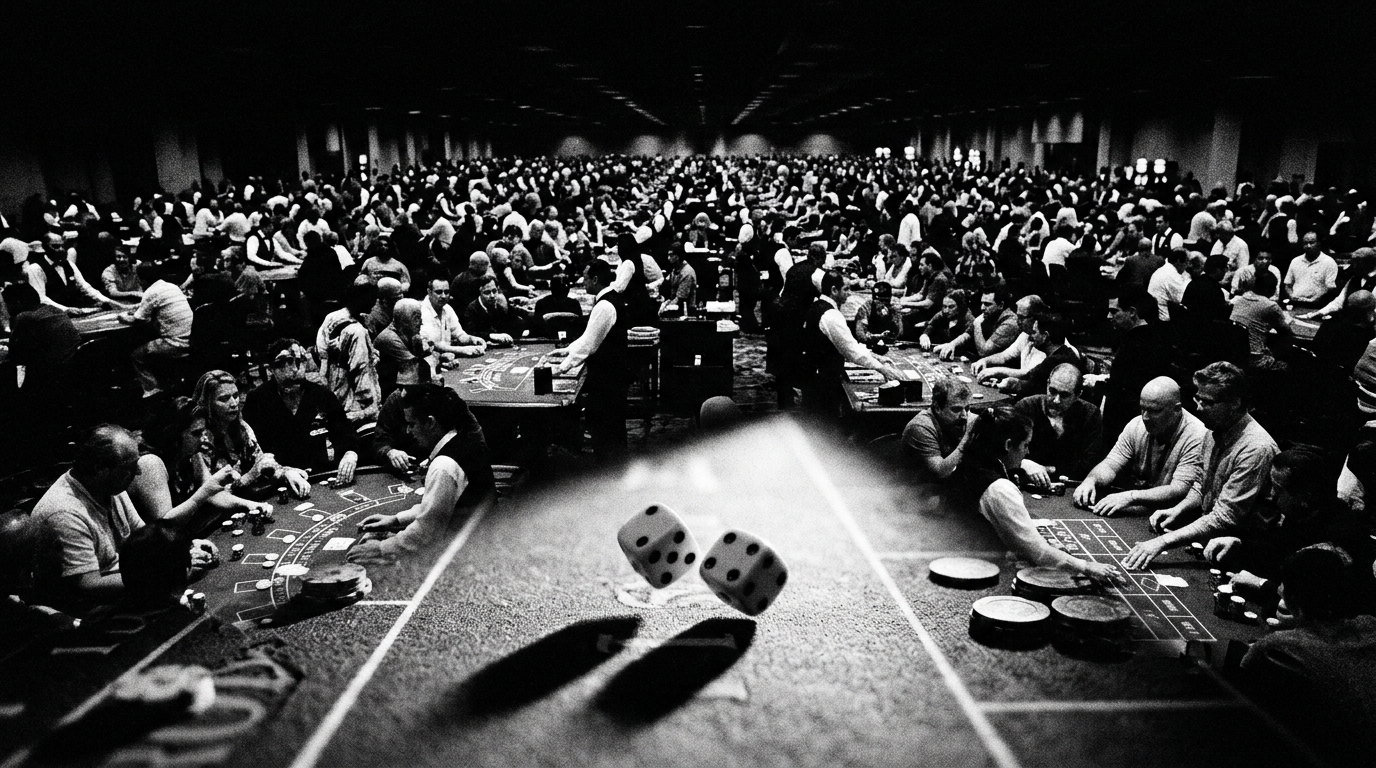
Las Vegas Sands posted a quarter that looked ugly on the surface... earnings missed by 30%, stock dropped 5%, and Macau EBITDA fell 24%. But strip out the hold variance and what you find underneath is a company that grew gaming volumes 30-73% while everyone else in the market stayed flat.

I worked with a casino resort GM once who kept two sets of numbers on his desk. Not in a shady way... one was the reported financials, and one was what he called the "if the dice were normal" sheet. Every quarter he'd strip out hold variance and show ownership what the operation actually produced versus what luck delivered. His point was always the same: "Judge me on what I can control. The math on the felt is God's problem."

That's the lens you need for Las Vegas Sands' Q2 2026 numbers, because the headline looks like a disaster. Consolidated adjusted property EBITDA came in at $1.12 billion, down from $1.33 billion a year ago. EPS of $0.53 missed analyst estimates by roughly 30%. The stock dropped 5% after hours. If you stopped there, you'd think the wheels were coming off.

But here's what actually happened in Macau. VIP rolling hold came in at 1.35% for the quarter. Normal range is somewhere around 2.7-3.0%. That's not a management failure... that's variance. Pure, mathematical, predictable-over-time-but-unpredictable-in-any-given-quarter variance. Sands China themselves estimated it cost them $87 million in EBITDA. Add that back and Macau's number moves from $430 million to $517 million... still down year-over-year, but a completely different conversation. Meanwhile, rolling table volumes were up 73%. Non-rolling up 15%. Slots and ETGs up 30%. Mass market GGR share hit 25%, up 100 basis points. In a market where total gross gaming revenue was flat, Sands China was taking share from everybody. That's not a company in trouble. That's a company building volume on top of a quarter where the math happened to break against them.

Singapore told its own story. Marina Bay Sands put up $689 million in property EBITDA... down 10% from Q2 2025, but that number actually got a $37 million tailwind from favorable hold. Mass gaming revenues grew 5%. The expansion project (570 suites, 15,000-seat arena) is tracking for early 2031. This is still the single most profitable integrated resort on the planet. Patrick Dumont is spending $787 million a quarter buying back stock, and the board just bumped the repurchase authorization to $6 billion. You don't do that when you're worried about the fundamentals.

Here's what I think people miss about a quarter like this, and it matters whether you're running a casino resort or a 200-key select-service. The market punishes reported numbers. The market doesn't care about hold adjustments or volume trajectories or the fact that you grew every segment while your competitors went sideways. Wall Street reads the top line, compares it to the estimate, and reacts. That's the game. But if you're an operator... if you're the person actually inside the building... you know the difference between a bad quarter and a broken operation. LVS had a bad quarter. The operation underneath it is gaining market share across every segment in both markets while simultaneously spending billions on expansion and buybacks. The Venetian Macau renovation started in March, won't finish until Chinese New Year 2028... that's a nearly two-year disruption window they're absorbing while still growing volumes. That tells you something about the machine they've built.

Operator's Take

If you're running a casino property or an integrated resort, this is a reminder to build the "normalized" version of your numbers every single quarter, whether ownership asks for it or not. Separate what you controlled from what you didn't. Hold variance, weather events, one-time group cancellations... whatever it is, have that story ready with the math behind it before the P&L lands on someone's desk. If you let the raw number speak for itself, someone else will narrate it for you... and they won't be as generous. LVS is dealing with a 73% increase in rolling table volume being completely overshadowed by a hold percentage that came in 150 basis points below normal. The operators who survive these cycles are the ones who proactively frame performance in context, not the ones who wait to be asked what happened.

Read full analysis → ← Show less
Source: Google News: Las Vegas Sands
OUE REIT Cut Financing Costs 17.8%. The Hospitality Segment Is Doing the Heavy Lifting.

OUE REIT Cut Financing Costs 17.8%. The Hospitality Segment Is Doing the Heavy Lifting.

OUE REIT's first quarter shows a textbook case of what happens when a diversified REIT rides a hospitality tailwind while simultaneously cleaning up its balance sheet. The question is whether the 41.5% leverage ratio leaves enough room to keep acquiring at this pace.

S$17.2 million in financing costs, down 17.8% year-over-year. That's the headline number. The real number is S$24.3 million in hospitality NPI, up 16.8%, on RevPAR of S$277 (an 11.7% gain). The hospitality segment now represents 38% of total revenue and is growing at more than double the rate of the overall portfolio. Strip out hospitality and this is a 2-3% growth story. With it, it's 6.7% revenue growth and 8.4% NPI growth. One segment is carrying the REIT.

Let's decompose the financing side. Weighted average cost of debt at 4.1% as of 3Q 2025, with 66.7% fixed-rate. The OUE Bayfront refinancing in August 2025 drove a meaningful chunk of the savings. A 17.8% reduction in financing costs on a base of roughly S$20.9 million (implied prior year) translates to S$3.7 million in annual savings at run rate. That's not nothing... but it's a one-time structural benefit from refinancing, not a repeatable engine. Next quarter's comparison gets harder unless rates decline further.

The acquisition pace is what I'd watch. The A$357.2 million purchase of a 19.9% stake in 180 George Street, Sydney, closed in March. That's a minority interest in a single asset at roughly S$319.8 million. Meanwhile, aggregate leverage sits at 41.5%. Singapore's regulatory limit for REITs is 50% (45% without a credit rating, but OUE has one). That leaves approximately 8.5 percentage points of headroom. On a portfolio of this size, that's not unlimited capacity. The S$43 million CapEx approved for converting OUE Bayfront's Level 17 into office space (projected stabilized ROI exceeding 11%) is a smarter use of capital than external acquisitions at current pricing... but it ties up dry powder.

The hospitality thesis here is straightforward: Singapore tourism arrivals projected at 17-18.5 million in 2025, constrained hotel supply pipeline, and event-driven demand (Singapore Airshow, cruise activity). RevPAR at S$277 is well above pre-pandemic levels. The risk is mean reversion. Singapore's hospitality market has historically been cyclical, and a RevPAR growing 11.7% year-over-year implies either genuine structural demand improvement or a peak that's getting closer. I've analyzed enough hospitality REITs to know that the quarter where everything looks perfect is often the quarter before the inflection.

The 95.2% office occupancy with 6.0% positive rental reversion is solid but unremarkable. The office segment is the ballast, not the growth engine. What makes OUE REIT interesting (and risky) right now is the concentration of growth momentum in hospitality. If Singapore tourism softens... and tourism always softens eventually... the diversification that's supposed to protect unitholders gets tested. At 41.5% leverage, the margin for error is thinner than management's tone suggests.

Operator's Take

Here's what matters if you're an asset manager or owner watching Singapore hospitality REITs as a comp or a signal. That S$277 RevPAR is instructive... it tells you what a constrained-supply gateway city can deliver when tourism demand runs hot. If you're operating in any market where new supply is limited and event-driven demand is growing, benchmark your RevPAR growth against this. Are you capturing your share? If your market has similar demand tailwinds and you're not seeing double-digit RevPAR gains, the problem is pricing discipline or distribution cost, not the market. Run your total brand and distribution cost as a percentage of revenue. If it's north of 15% and your RevPAR growth isn't keeping pace with a REIT that's posting 11.7%, you're working harder and keeping less. That's a conversation to have with your revenue team this week, not next quarter.

— Mike Storm, Founder & Editor
Read full analysis → ← Show less
Source: Google News: Hotel REIT
End of Stories