Today · Jul 30, 2026
Accor's RevPAR Grew 2.2%. Without the Middle East, It Was 4.6%. That Gap Is the Story.

Accor's RevPAR Grew 2.2%. Without the Middle East, It Was 4.6%. That Gap Is the Story.

Accor posted €2.76 billion in H1 revenue and a 6.5% EBITDA gain, but the 240-basis-point RevPAR drag from the Middle East reveals how much geographic concentration risk still lives inside "diversified" portfolios.

Available Analysis

Accor reported €2,760 million in H1 2026 revenue, up 3.0% at constant currency. Recurring EBITDA hit €563 million, a 6.5% gain. Recurring free cash flow jumped 42% to €194 million. The headline reads resilience. The decomposition reads something more complicated.

Group RevPAR grew 2.2%. Strip out the Middle East and that number becomes 4.6%. That's a 240-basis-point drag from a single region. The UAE hospitality market saw occupancy drop 27.7 percentage points and RevPAR decline 31.8% year-over-year through June, according to CBRE data from two days ago. Accor's Lifestyle segment, which has significant UAE exposure, absorbed a disproportionate share of that hit. Management noted that gains in Egypt, North Africa, and Morocco offset roughly half the Middle East losses. Half. The other half bled through.

Net profit fell to €114 million from €233 million in H1 2025 (a 51% decline). Accor attributes this to "non-recurring expenses." I've audited enough hotel company financials to know that "non-recurring" is the most recurring category in hospitality accounting. The planned sale of a 30.7% stake in Essendi for up to €975 million, expected to close Q4, will generate its own set of non-recurring items. The asset-light narrative continues... and so does the question of who actually holds the real estate risk once these dispositions close. The management company collects fees. The new owner of that Essendi stake holds the downside. Same P&L, two stories.

The pipeline number deserves scrutiny. Accor opened 109 hotels (roughly 14,000 rooms) in H1 and reports a pipeline of 268,000 rooms across 1,595 hotels, up 11.4%. But full-year network growth guidance quietly dropped from "over 4%" to "approximately 3.5%." That's a meaningful revision buried inside an otherwise positive outlook. When a company with a 268,000-room pipeline lowers its net growth forecast, the conversion and opening timeline is slipping. Letters of intent aren't hotels. I will never stop saying this.

The €450 million share buyback program tells you where management believes the value is. When a company is simultaneously selling assets, lowering growth guidance, and buying back stock, the capital allocation message is clear: we think the stock is cheap, and we'd rather return cash than deploy it into a market where one regional conflict just wiped 240 basis points off our RevPAR growth. That's not necessarily wrong. But if you're an owner inside this system, notice that the capital is flowing to shareholders, not to your property.

Operator's Take

If you're an owner or asset manager with properties flagged under a global operator like Accor, this is a stress-test moment. Run your trailing 12-month numbers against a scenario where your primary feeder market drops 30% in RevPAR. Not because it will... because Accor just showed you what happens when it does. The 240-basis-point drag from one region is real math that hit real properties. This is what I call the Shockwave Response... know your floor and your breakeven before the shock arrives. If your property sits in a market with geopolitical exposure or single-source demand concentration, build that downside model this week. Don't wait for the conflict. Know your number before the phone rings.

— Mike Storm, Founder & Editor
Read full analysis → ← Show less
Source: Google News: Accor Hotels
Wyndham's Revenue Dropped 6%. Their Profit Jumped 17%. Owners Should Read Between Those Lines.

Wyndham's Revenue Dropped 6%. Their Profit Jumped 17%. Owners Should Read Between Those Lines.

Wyndham just posted a quarter where less money came in and more profit went out, which sounds like magic until you understand the mechanics. The gap between what the franchisor is earning and what the franchisee is experiencing has never been easier to calculate... or harder to ignore.

Available Analysis

I sat in a franchise advisory council meeting once where an owner stood up, pointed at the brand's quarterly earnings slide, and said "You're having a great year. I'm having a terrible year. We're in the same building. Explain that to me." Nobody could. The room got very quiet, and then someone changed the slide. That moment lives in my head every time I read a franchisor earnings report, and Wyndham's Q2 is exactly the kind of quarter that makes that owner's question louder than ever.

Let's look at what actually happened here. Net revenues fell 6% to $375 million, which sounds concerning until you realize the drop was almost entirely technical... last year had a big franchisee conference generating pass-through revenue, and fees from the now-insolvent Revo Hospitality Group got deferred. Strip those out and the underlying fee engine is humming. Adjusted EBITDA climbed 9% to $212 million. Net income jumped 17%. Adjusted free cash flow hit $105 million, up 19%. They returned $86 million to shareholders through buybacks and dividends. And they raised their full-year outlook. From the franchisor's chair, this is a beautiful quarter. The stock dropped 3% anyway because revenue missed Wall Street's target by about $26 million, which tells you something about the disconnect between how hotels work and how analysts model them, but that's a different conversation.

The number I keep circling back to is U.S. RevPAR growth of 2%, which beat expectations by 120 basis points. That's genuinely good for the economy and midscale segments Wyndham dominates. But here's where the brand-versus-owner tension starts to sharpen. Wyndham's strategy is explicitly about replacing lower-quality, lower-FeePAR rooms with higher-quality, higher-FeePAR rooms. Their development pipeline hit a record 261,000 rooms carrying a FeePAR premium of approximately 30% over the existing system. That's fantastic for Wyndham's fee revenue per available room. For the existing franchisee whose comp set just got a shinier new-build down the street flying the same flag? That's a different story entirely. The pipeline is the brand investing in your replacement while you're still paying for your last PIP. (I've watched this pattern at three different flags. It always gets presented as "elevating the brand." It always feels different when you're the one being elevated past.)

Two things buried in the details deserve your attention. First, the Wyndham Rewards restructuring coming in September... free nights starting at 5,000 points instead of 7,500 sounds like a win for guests until you realize aspirational properties are jumping from 30,000 to 45,000 points. That's a classic loyalty program squeeze: make redemption easier at the bottom of the portfolio and harder at the top, which drives volume to economy properties and protects rate integrity at the upper tiers. If you're running a Wyndham economy property, you're about to become a redemption magnet, and you need to understand what that does to your ADR mix. Second, the data center demand story is genuinely interesting... Wyndham says 400-plus of their hotels near planned data center projects are outperforming by roughly 200 basis points. That's real, specific, and actionable demand that has nothing to do with leisure travel or loyalty programs. If you're near one of those projects, you already know. If you're not sure, find out.

The international picture is a different animal entirely. Global RevPAR declined 1%, dragged down by a 6% international drop with weakness across Europe, Latin America, the Caribbean, and the Middle East. Wyndham's domestic strength is real. Their international exposure is a drag. For owners in the U.S. system, this matters less directly... but it matters when the brand is making capital allocation decisions about where to invest in technology, marketing, and development support. A franchisor chasing international growth with your domestic loyalty assessment dollars is the kind of thing that doesn't show up in the earnings call Q&A but absolutely shows up in your statement.

Operator's Take

If you're a Wyndham franchisee, pull your total brand cost as a percentage of revenue right now. Franchise fees, loyalty assessments, reservation fees, marketing contributions, brand-mandated vendor costs... all of it. Then compare it to the incremental revenue you can specifically attribute to the flag. Not what they projected when you signed. What you're actually getting. That's your real franchise ROI, and it's the only number that matters when your agreement comes up for renewal. This is what I call the Brand Reality Gap... the brand is posting 9% EBITDA growth on fees you're paying, while your GOP margin may be telling a very different story. On the loyalty restructuring coming in September, get ahead of it. Model what happens to your ADR mix if redemption volume increases at your property. If you're economy or midscale, run the numbers before the points change hits your books, not after. And if you're anywhere near a data center construction zone, reprice your extended-stay and corporate inventory now. That 200 basis point premium is real demand, and someone in your comp set is already chasing it.

— Mike Storm, Founder & Editor
Read full analysis → ← Show less
Source: Google News: Wyndham
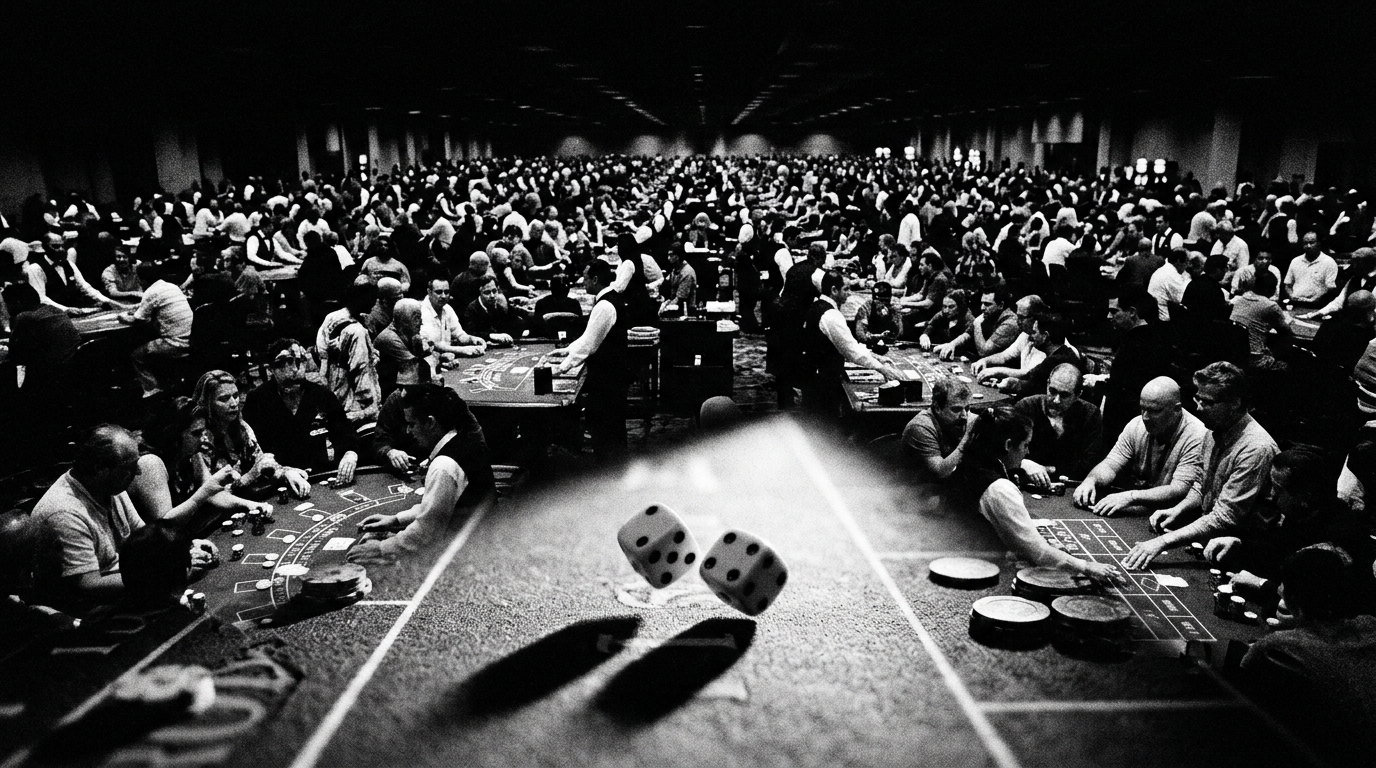
LVS Lost $87 Million to Bad Luck in Macau. The Volume Underneath Tells a Different Story.

LVS Lost $87 Million to Bad Luck in Macau. The Volume Underneath Tells a Different Story.

Las Vegas Sands posted a quarter that looked ugly on the surface... earnings missed by 30%, stock dropped 5%, and Macau EBITDA fell 24%. But strip out the hold variance and what you find underneath is a company that grew gaming volumes 30-73% while everyone else in the market stayed flat.

I worked with a casino resort GM once who kept two sets of numbers on his desk. Not in a shady way... one was the reported financials, and one was what he called the "if the dice were normal" sheet. Every quarter he'd strip out hold variance and show ownership what the operation actually produced versus what luck delivered. His point was always the same: "Judge me on what I can control. The math on the felt is God's problem."

That's the lens you need for Las Vegas Sands' Q2 2026 numbers, because the headline looks like a disaster. Consolidated adjusted property EBITDA came in at $1.12 billion, down from $1.33 billion a year ago. EPS of $0.53 missed analyst estimates by roughly 30%. The stock dropped 5% after hours. If you stopped there, you'd think the wheels were coming off.

But here's what actually happened in Macau. VIP rolling hold came in at 1.35% for the quarter. Normal range is somewhere around 2.7-3.0%. That's not a management failure... that's variance. Pure, mathematical, predictable-over-time-but-unpredictable-in-any-given-quarter variance. Sands China themselves estimated it cost them $87 million in EBITDA. Add that back and Macau's number moves from $430 million to $517 million... still down year-over-year, but a completely different conversation. Meanwhile, rolling table volumes were up 73%. Non-rolling up 15%. Slots and ETGs up 30%. Mass market GGR share hit 25%, up 100 basis points. In a market where total gross gaming revenue was flat, Sands China was taking share from everybody. That's not a company in trouble. That's a company building volume on top of a quarter where the math happened to break against them.

Singapore told its own story. Marina Bay Sands put up $689 million in property EBITDA... down 10% from Q2 2025, but that number actually got a $37 million tailwind from favorable hold. Mass gaming revenues grew 5%. The expansion project (570 suites, 15,000-seat arena) is tracking for early 2031. This is still the single most profitable integrated resort on the planet. Patrick Dumont is spending $787 million a quarter buying back stock, and the board just bumped the repurchase authorization to $6 billion. You don't do that when you're worried about the fundamentals.

Here's what I think people miss about a quarter like this, and it matters whether you're running a casino resort or a 200-key select-service. The market punishes reported numbers. The market doesn't care about hold adjustments or volume trajectories or the fact that you grew every segment while your competitors went sideways. Wall Street reads the top line, compares it to the estimate, and reacts. That's the game. But if you're an operator... if you're the person actually inside the building... you know the difference between a bad quarter and a broken operation. LVS had a bad quarter. The operation underneath it is gaining market share across every segment in both markets while simultaneously spending billions on expansion and buybacks. The Venetian Macau renovation started in March, won't finish until Chinese New Year 2028... that's a nearly two-year disruption window they're absorbing while still growing volumes. That tells you something about the machine they've built.

Operator's Take

If you're running a casino property or an integrated resort, this is a reminder to build the "normalized" version of your numbers every single quarter, whether ownership asks for it or not. Separate what you controlled from what you didn't. Hold variance, weather events, one-time group cancellations... whatever it is, have that story ready with the math behind it before the P&L lands on someone's desk. If you let the raw number speak for itself, someone else will narrate it for you... and they won't be as generous. LVS is dealing with a 73% increase in rolling table volume being completely overshadowed by a hold percentage that came in 150 basis points below normal. The operators who survive these cycles are the ones who proactively frame performance in context, not the ones who wait to be asked what happened.

Read full analysis → ← Show less
Source: Google News: Las Vegas Sands
Choice Hotels Hit Record Revenue and Still Missed. That's the Whole Brand Story.

Choice Hotels Hit Record Revenue and Still Missed. That's the Whole Brand Story.

Choice Hotels posted its highest quarterly revenue ever and still missed earnings estimates by double digits, which tells you everything about where the money is actually going in a franchise-driven model. The CEO departure three weeks later wasn't a coincidence... it was punctuation.

Available Analysis

Let me tell you something I've learned from sitting on both sides of the franchise table for the better part of two decades: when a franchisor posts record revenue and still can't hit its earnings number, that is not a timing problem. That is a structural one. And somebody at headquarters knows it, even if the earnings call language is designed to make sure you don't.

Choice Hotels pulled in $340.6 million in Q1 2026... a company record, 2.3% above last year, beat the revenue estimate. And then the adjusted EPS came in at $1.07 against a consensus of $1.28 to $1.35. That's not a miss. That's a gap you could park a shuttle bus in. Management pointed to elevated tax rates, "timing-related factors" (my absolute favorite corporate euphemism... it means "we spent more than we earned and we'd prefer not to discuss it"), and increased franchise agreement acquisition costs tied to higher room openings. That last one is the interesting piece. Choice is spending more money to sign new deals, which means the cost of growth is outpacing the revenue from growth. If you're a franchisee, pause on that for a second. The company is investing aggressively to bring MORE owners into the system... and the margin on doing so is compressing. Where do you think they make that margin back? (You already know the answer. It's your P&L.)

U.S. RevPAR declined 2.3% year-over-year, and yes, there's a hurricane comp baked in there... roughly 410 basis points, per management. Strip that out and you get a 1.8% increase, which sounds better until you remember that costs didn't decline 1.8%. They went up. Global net rooms grew 1.7%, and franchise agreements awarded jumped 72%, which is a genuinely impressive development number... but development numbers are future revenue, not current earnings. The pipeline is full. The P&L is not. And that tension is the story nobody on the earnings call wanted to name, so I'll name it: Choice is building scale at the expense of current profitability, and the franchisees are the ones absorbing the drag while the system catches up. This is a pattern I've watched play out at multiple franchise companies over the years, and the owners holding the flag during the growth phase rarely feel like they're winning, because they're not. Not yet. Maybe not ever, depending on what "growth" actually delivers to their specific property.

Then there's the leadership piece, and I'm sorry, but you cannot separate the two. Patrick Pacious stepped down as CEO on May 20th, three weeks after an earnings report that sent the stock down 13% in a single session. The company says the full-year outlook is unchanged ($6.92 to $7.14 adjusted EPS, which is still below the consensus of $7.17 to $7.22, by the way). They installed Dominic Dragisich as interim CEO... former CFO, then Chief Growth and Strategy Officer. A finance-to-strategy guy running the show during a period where the brand needs to prove that growth spending converts to owner-level returns. That's either exactly the right move or a very expensive placeholder. We'll know which one by Q3. What I can tell you from watching multiple franchise leadership transitions is this: interim CEOs either become permanent CEOs who reshape the strategy, or they become the person who kept the lights on while the board figured out what they actually wanted. There is no in-between. And franchisees should be paying very close attention to which version this is, because the strategic direction of your franchisor is not an abstract concept... it shows up in your PIP timeline, your loyalty contribution, your technology mandates, and ultimately your bottom line.

Here's the part that kept me up last night (and I mean that... I pulled the FDD). Choice has expanded from 11 to 22 brands under the outgoing CEO's tenure. Twenty-two brands. At some point, brand proliferation stops being portfolio strategy and starts being internal competition with a shared reservation system. If you're an owner in the midscale or extended-stay segment right now, you should be asking one very specific question: how many of those 22 brands are competing for the same guest I'm trying to capture, and what is the company doing to make sure my flag gets its share versus the seven other flags in the same tier? Because "we have a brand for every segment" sounds fantastic in a franchise sales pitch. It sounds a lot less fantastic when you're the Comfort Inn watching a new Everhome open three miles away and both of you are pulling from the same loyalty pool. The filing cabinet doesn't lie. And neither does a three-mile radius.

Operator's Take

If you're a Choice franchisee, pull your loyalty contribution numbers for the last four quarters and compare them against what you were projected at signing. That variance is your leverage in every conversation with your franchise rep from here forward. With a new CEO settling in, there's a narrow window where the company will be more responsive to franchisee feedback than usual... use it. Get your total brand cost as a percentage of revenue calculated (franchise fees, loyalty assessments, reservation fees, technology mandates, marketing contributions, all of it) and know that number cold. If it's north of 15% and your RevPAR index is flat or declining, that's a conversation you bring to your next ownership meeting with a plan attached. Don't wait for the brand to tell you what's changing. Be the operator who already has the math done and the questions ready.

— Mike Storm, Founder & Editor
Read full analysis → ← Show less
Source: Google News: Choice Hotels
Wynn's $592 ADR in Vegas Is the Luxury Ceiling. Everyone Else Is Fighting for the Floor.

Wynn's $592 ADR in Vegas Is the Luxury Ceiling. Everyone Else Is Fighting for the Floor.

Wynn just posted a 12.3% ADR jump in Las Vegas while its Macau margins quietly compressed and Boston slipped backward. The Q1 earnings look like a jackpot until you decompose which properties are actually generating returns for the equity holder.

Available Analysis

Wynn Resorts posted $1.86 billion in Q1 2026 operating revenue, up 9.2% year-over-year. Net income nearly doubled to $120.5 million. Adjusted Property EBITDAR hit $562.4 million. The headline is strong. The decomposition is more interesting.

Las Vegas carried this quarter. Operating revenues rose $36.6 million to $661.9 million. Adjusted Property EBITDAR grew to $232.5 million. ADR climbed 12.3% to $592. RevPAR up nearly 10%. Casino revenues up 9%. March was a record. The convention calendar helped (CONEXPO alone moves needles in that market), but this isn't just event-driven... Wynn's luxury positioning is pulling rate in a way that widens the gap between the top of the Strip and everything below it. The company claims its EBITDAR per hotel room has grown at nearly three times the rate of Strip competitors since 2019. That's not a rising tide. That's stratification.

The rest of the portfolio tells a different story. Wynn Palace in Macau posted $203.8 million in Adjusted Property EBITDAR, up from $161.9 million, driven by a 32% increase in mass market table drop. But VIP turnover declined 9.9%, and consolidated margins compressed from 31.3% to 30.3%. Wynn Macau's EBITDAR dropped $14.6 million on flat revenue. Encore Boston Harbor's EBITDAR fell $6.9 million. Two of the four reporting segments moved backward. The portfolio-level number obscures a concentration problem... Las Vegas is doing the heavy lifting and the other properties are along for the ride.

Capital allocation adds another layer. Wynn repurchased 528,667 shares for $53.8 million during the quarter at roughly $102 per share (the stock trades near the same level now). The $0.25 quarterly dividend is modest. The real capital story is forward-looking: $3.9 billion committed to the UAE project with ~40% equity exposure, and $900-$950 million for a 432-suite tower at Wynn Palace. That's significant development spend funded while two of four segments are declining. The UAE project targets a 2027 opening. The Macau tower starts construction in H2 2026 with a 2.5-year build. Neither generates revenue for years. The equity holder is betting that Las Vegas keeps performing at this level long enough to bridge the gap.

Adjusted diluted EPS came in at $1.25 against a $1.26 consensus. A penny miss on a revenue beat. Deutsche Bank cut its price target from $144 to $137 the next morning. The stock dipped 0.67% after hours. The market's message is clear: strong top line, fine, but show us the margin story and explain how $4.8 billion in development spend generates returns when half your current portfolio is flat or declining. That's not a bearish read. It's just the math.

Operator's Take

Look... Wynn's $592 ADR is the number that should be on every luxury and upper-upscale operator's whiteboard this week. Not because you're going to hit it. Because it tells you where the ceiling is in the strongest urban luxury market in America, and it gives you a reference point for your own rate strategy. If you're running a 300-key upper-upscale on the Strip or in any top-10 convention market, pull your Q1 ADR growth and compare it to 12.3%. If you're not keeping pace with the top of your comp set, rate erosion isn't happening because of the market... it's happening because of positioning. The other thing worth noting: Wynn is pouring billions into development while two of its four segments are going sideways. That's a luxury play with a long fuse. If you're an owner looking at a major capital project right now, stress-test the revenue assumptions against what happens if your best-performing asset cools off by even 10%. Because Wynn can absorb that. Most of us can't.

— Mike Storm, Founder & Editor
Read full analysis → ← Show less
Source: Google News: Wynn Resorts
MGM's Strip Revenue Grew. Strip Profits Dropped 8%. That's the Story Nobody's Leading With.

MGM's Strip Revenue Grew. Strip Profits Dropped 8%. That's the Story Nobody's Leading With.

MGM posted $4.5 billion in record quarterly revenue and the Las Vegas Strip finally grew again after 18 months. But Strip EBITDAR fell 8% while occupancy slipped and RevPAR declined, which means the machine is running hotter and earning less... and that pattern should sound familiar to anyone who's managed a hotel through a cost cycle.

Available Analysis

I sat in on an owners meeting years ago where the GM proudly announced a 6% revenue increase. The asset manager leaned back, didn't even look up from the financials, and said "your expenses grew 11%. You didn't grow. You just got busier." Room went quiet. That moment lives rent-free in my head every time I see a record revenue headline paired with declining profitability.

MGM just posted $4.5 billion in consolidated revenue for Q1... a 4% bump year-over-year and an all-time record. The Las Vegas Strip finally returned to growth after 18 months of decline. Convention ADRs hit records. Catering revenue surged. BetMGM turned profitable. The headline writers had a field day. But here's what the headline doesn't tell you. Net income dropped from $149 million to $125 million. Adjusted EBITDA fell almost 9% to $580 million. On the Strip itself, where the flagship properties live, segment EBITDAR declined 8% to $749 million despite that revenue growth. Occupancy fell from 94% to 92%. RevPAR dropped 2% to $238. They sold more, served more, programmed more, promoted more... and kept less. That's not a growth story. That's a flow-through problem wearing a growth story's clothes.

The culprits are instructive. Self-insurance costs spiked $37 million on the Las Vegas side alone, another $9 million regionally. That's $46 million in cost pressure that has nothing to do with how well you're running the hotel. It's the cost of being in business in 2026. They also launched all-inclusive packages at Luxor and Excalibur... a smart play to attract first-time Vegas visitors (their COO noted a significant chunk of those bookings are new-to-market guests), but all-inclusive means higher cost-to-serve per room night. You're bundling margin into a fixed price. It works when it drives incremental demand. It compresses profitability when it replaces demand you would have captured anyway. The jury's still out on which one this is. Meanwhile, Canadian visitation dropped 30-40%, which is a real number when you're talking about a market that historically sends a reliable feeder of mid-week casino guests to the Strip.

The digital side is where the actual narrative energy should be. BetMGM posted $696 million in revenue and turned an Adjusted EBITDA profit of $25 million. LeoVegas surged 43% to $183 million. These are real growth engines. But even here, the fine print matters... BetMGM missed analyst revenue forecasts by 14% and EBITDA estimates by 68%, and they quietly lowered full-year guidance from $3.1-3.2 billion down to $2.9-3.1 billion. Profitable but disappointing is a weird place to be, and it's where a lot of hotel operators live every single quarter.

Here's what matters if you're not running a casino resort on the Strip. The pattern. Revenue up, profits down, costs rising in categories you can't control, and a growing reliance on promotional packaging to drive top-line growth. That's not an MGM-specific story. That's the 2026 hospitality story. Insurance costs are eating margins industry-wide. Labor hasn't gotten cheaper. The temptation to chase revenue through discounting or bundling is real and the flow-through consequences are brutal. MGM can absorb a quarter like this because they have $4.5 billion in revenue and a digital gaming division to subsidize the brick-and-mortar compression. You probably don't. Which means you need to be watching your own flow-through like your career depends on it. Because it does.

Operator's Take

This is what I call the Flow-Through Truth Test, and MGM just illustrated it at scale. Revenue growth only matters if enough of it reaches GOP and NOI. If you're running a 150- to 300-key property and you've been celebrating top-line gains this quarter, pull your expense growth and put them side by side. Right now. Not next month. Check your insurance renewals... if you haven't seen the spike yet, it's coming. Check your cost-per-occupied-room against the same quarter last year. And if you've been running any kind of promotional packaging or bundled rate to drive occupancy, calculate the actual margin on those room nights versus your standard transient rate. If the package is replacing bookings you'd have gotten at rack, you're paying to look busy. Bring that analysis to your ownership group before the quarterly review. Don't wait for them to notice the margin compression on their own and ask you to explain it. Be the one who names it, quantifies it, and has a plan. That's the difference between a GM who runs a hotel and a GM who runs a business.

Read full analysis → ← Show less
Source: Google News: MGM Resorts
Hilton's 3.6% RevPAR Growth Hides a $3.5 Billion Question About Who Actually Benefits

Hilton's 3.6% RevPAR Growth Hides a $3.5 Billion Question About Who Actually Benefits

Hilton beat Q1 estimates and raised its full-year outlook, but the gap between what's celebrated at corporate and what flows to the owner's bottom line keeps widening. The record pipeline and $3.5 billion in planned capital returns tell two very different stories depending on which side of the franchise agreement you're sitting on.

Available Analysis

Hilton posted $2.01 adjusted EPS against a $1.96 consensus, raised full-year RevPAR guidance to 2-3% (up from 1-2%), and announced a record 527,000-room pipeline. Adjusted EBITDA hit $901 million, up 13% year-over-year. The stock dropped 3.3% pre-market. That disconnect between the earnings beat and the market reaction is the first number worth paying attention to.

The second number is $3.5 billion. That's Hilton's projected total capital return for 2026... share repurchases plus dividends. Compare that to the 16,300 rooms they added in Q1. The asset-light model generates cash for shareholders at a rate that has almost nothing to do with whether individual hotels are thriving or struggling. An owner carrying $4 million in PIP debt on a select-service conversion doesn't participate in that $3.5 billion. The franchise fee flows one direction. The capital return flows another. Same company, two completely different economic realities. I audited management companies where this gap was the single largest source of owner frustration, and it never showed up in any earnings presentation.

CEO Nassetta's "C-shaped economy" thesis... that demand is broadening from luxury into mid-scale and lower tiers... is worth decomposing. If he's right, that's an occupancy story, not a rate story. Occupancy-driven RevPAR gains compress margins because variable costs (housekeeping, amenities, utilities) scale with heads in beds. Rate-driven gains flow to GOP at 80-90 cents on the dollar. Occupancy gains flow at maybe 40-50 cents. So when Hilton reports 3.6% system-wide RevPAR growth, the question for every franchised owner is: how much of that is rate and how much is occupancy? The earnings release celebrates the blended number. The owner's P&L tells the real story at the property level.

The Middle East drag is instructive. RevPAR there fell 1.7% in Q1 and is guided down mid-to-high teens for the full year. For a 527,000-room pipeline with meaningful international exposure, regional concentration risk isn't theoretical. But what caught my attention is the pipeline itself: 527,000 rooms represents roughly 5% growth from last year. Letters of intent aren't operating hotels. I will never stop flagging this. A "record pipeline" measures developer optimism, not guest demand. The conversion between signed and opened has historically averaged 60-70% across the industry over a full cycle. Apply that haircut and the pipeline looks solid but not historic.

Hilton is executing its model precisely as designed. Adjusted EBITDA up 13%. Pipeline at record levels. Capital returned to shareholders at $860 million in Q1 alone. For the publicly traded entity, this is a clean quarter. For the owner of a 180-key Hampton paying franchise fees, loyalty assessments, PMS mandates, and a PIP that came in 30% over estimate... the celebration sounds different from where they're sitting.

Operator's Take

Here's what I want you to do this week if you're a franchised owner or a GM managing to an ownership P&L. Pull your Q1 RevPAR growth and split it into rate versus occupancy. If your growth was occupancy-led, check your flow-through... every point of occupancy costs you something, and if your GOP margin didn't grow alongside revenue, you're running harder to stay in place. That's what I call the Flow-Through Truth Test. Revenue growth is not profit growth until you prove it on the bottom line. Second thing... look at your total brand cost as a percentage of revenue. Franchise fees, loyalty, technology mandates, reservation fees, all of it. If you're north of 15%, you need to know exactly what incremental revenue that brand is delivering versus what you'd capture as an independent or under a softer flag. Hilton's having a great quarter. Make sure you are too.

— Mike Storm, Founder & Editor
Read full analysis → ← Show less
Source: Google News: Hotel RevPAR
Booking Holdings Reports Today. Here's What Hotel Owners Should Already Know.

Booking Holdings Reports Today. Here's What Hotel Owners Should Already Know.

Wall Street expects $5.52 billion in Q1 revenue from Booking Holdings, up 16% year-over-year, fueled by a merchant model that now controls 61% of total revenue. The question for hotel owners isn't whether the quarter beats estimates... it's how much of your margin moved to their balance sheet.

Booking Holdings releases Q1 2026 results at 4:00 p.m. ET today with consensus at $5.52 billion in revenue and $1.07 EPS. The 16% year-over-year revenue growth estimate tracks against company guidance of 14-16%. Room night growth was guided at 5-7%. That gap between room night growth and revenue growth is the number that matters to anyone who owns a hotel. Revenue growing three times faster than room nights means the yield per booking is expanding. Booking isn't selling more rooms. It's extracting more per room sold.

The mechanism is the merchant model. Booking now processes payments directly on approximately 61% of transactions, up from roughly half two years ago. Every percentage point of merchant model adoption shifts pricing power from the hotel to the platform. Bundled deals, loyalty program management, payment processing... these aren't services. They're margin capture. When a guest books through a merchant-model OTA, the hotel receives a net rate. The spread between what the guest paid and what the hotel received is Booking's growth story. An owner told me once, "I'm making money for everyone except myself." He was looking at his OTA commission statement when he said it.

The $700 million "strategic reinvestment" Booking announced for 2026 deserves decomposition. Generative AI, "Connected Trip," global expansion, advertising, OpenTable growth. They're projecting this investment to accelerate revenue growth by 100 basis points above their long-term 8% target. The offset: $500-550 million in "efficiency gains" from a transformation program. Net incremental spend of $150-200 million to generate an additional point of revenue growth on a $24 billion base. That's roughly $240 million in incremental revenue for $175 million in incremental cost. The math works for Booking. The question is what "works" means for the hotel supplying the room.

The stock tells a parallel story. Down 16% year-to-date despite a 25-for-1 stock split in early April designed to broaden the investor base. Analysts still rate it "Buy" with a median target around $222 post-split, but several have trimmed targets citing normalizing travel demand and AI disintermediation risk. That last concern is worth pausing on... if the market is pricing in a scenario where AI reduces OTA intermediation, the logical Booking response is to deepen platform dependency before that window closes. Faster merchant model adoption. More bundled products. Tighter integration with hotel inventory systems. Every "partnership enhancement" announcement from an OTA over the next 18 months should be read through this lens.

Italy's competition authority opened an antitrust probe on April 22 into Booking.com's commercial practices, following Spain's €413 million fine in 2024 (under appeal). Europe is systematically challenging OTA market power. The U.S. is not. For American hotel owners, the regulatory asymmetry means any competitive relief will be geographic, not structural. Your distribution cost isn't going down. The call starts at 4:30. Listen for merchant model penetration targets and "Connected Trip" conversion metrics. Those two numbers will tell you more about your 2027 distribution costs than anything in your current franchise agreement.

Operator's Take

Here's what I'd do before that earnings call even starts. Pull your last 90 days of OTA production and calculate your blended effective commission rate... not the stated rate, the actual net after merchant model markdowns, bundled package discounts, and loyalty point redemptions. If you're north of 18-20% effective cost on OTA bookings, your direct booking strategy isn't a marketing initiative anymore... it's a margin defense. For every point of OTA contribution you can shift to direct, you're recovering real dollars per occupied room. If you're a GM at a branded property, bring this analysis to your owner before they hear about Booking's blowout quarter and start asking why your OTA mix is climbing. Show up with the number and a plan. That's what separates operators who run the business from operators who report on it.

— Mike Storm, Founder & Editor
Read full analysis → ← Show less
Source: Google News: Booking Holdings
Pebblebrook's Q1 Earnings Date Is Routine. The Numbers Behind It Aren't.

Pebblebrook's Q1 Earnings Date Is Routine. The Numbers Behind It Aren't.

Pebblebrook just scheduled its Q1 2026 earnings call for April 29. The real story is what Q4 2025 already told us about a REIT trading at a 35% discount to NAV while quietly engineering a cash flow inflection.

Pebblebrook's Q4 2025 Adjusted FFO came in at $0.27 per diluted share, beating consensus by 25.81%. Revenue missed by 6.35% at $320.96 million. That divergence is the whole story. A REIT that's shrinking its top line and growing its bottom line is telling you exactly where management's attention is... and it's not on revenue growth. It's on cost structure, capital discipline, and debt reduction.

Let's decompose the Q4 numbers. Same-Property Hotel EBITDA rose 3.9% to $64.6 million on RevPAR growth of 2.9%. Out-of-room revenue grew 5.5%. The EBITDA beat the company's own midpoint by $2.2 million. That's flow-through discipline, not revenue expansion. Two dispositions generated $116.3 million in proceeds, $100 million of which went straight to debt paydown. They also closed a $450 million unsecured term loan maturing in 2031, replacing a $360 million facility due in 2027. Maturity extension plus deleveraging. The capital structure is being rebuilt while no one's watching.

The full-year 2025 net loss of $62.2 million includes $48.9 million in impairment charges from those dispositions. Strip the impairments and the operating loss narrows to $13.3 million. That's a REIT with 44 hotels and roughly 11,000 keys approaching breakeven on a GAAP basis while carrying $525 million in completed redevelopment capital. The 2026 outlook projects net income between negative $10.4 million and positive $3.6 million. The midpoint is essentially zero... which means 2026 is the year the redevelopment program either proves its thesis or doesn't. Same-Property RevPAR guidance of 2.25% to 4.25% growth and Adjusted FFO of $1.50 to $1.62 per share implies the company is pricing in modest recovery without heroic assumptions.

Here's what the earnings announcement doesn't surface. PEB closed Q4 at roughly $12.24 after a 7.15% post-earnings pop. Full-year 2026 FFO guidance midpoint of $1.56 puts the stock at approximately an 8x multiple. For a portfolio concentrated in urban and resort lifestyle assets with a freshly completed $525 million redevelopment cycle, that's cheap... unless you believe urban full-service is permanently impaired. The Q1 2026 outlook of $0.19 to $0.23 Adjusted FFO per share implies continued seasonality pressure, but the projected Q1 RevPAR growth of 7.5% to 9.0% suggests real momentum in markets like San Francisco that drove Q4 outperformance. The Palogic Value Fund withdrawing its activist campaign in February tells you something too. Either they got what they wanted behind closed doors, or they looked at the same math I just walked through and decided the thesis was already playing out.

The Q1 call on April 29 will matter for one reason. Capital allocation. With the redevelopment program largely complete, Pebblebrook's 2026 CapEx drops to normalized levels. That creates discretionary free cash flow that either goes to debt reduction, share repurchases at an 8x FFO multiple, or opportunistic acquisitions. The answer to that question reprices the stock. Everything else is noise.

Operator's Take

Here's why this matters even if you don't own PEB stock. When a major lifestyle REIT shifts from capital deployment mode to harvest mode, their operating expectations at property level change. If you're managing a Pebblebrook asset, expect tighter scrutiny on flow-through and GOP margin... they just proved to Wall Street they can beat earnings on cost discipline, and they're going to want that story to continue. Get ahead of your Q1 operating review. Know your cost-per-occupied-room number cold, because that's what the asset management call is going to be about.

— Mike Storm, Founder & Editor
Read full analysis → ← Show less
Source: Google News: Pebblebrook Hotel Trust
Monarch's CEO Sold $295K in Stock. He Still Holds $9.2 Billion in Options.

Monarch's CEO Sold $295K in Stock. He Still Holds $9.2 Billion in Options.

Monarch Casino's CEO sold 3,000 shares worth $295,430 while sitting on 6.67 million in option grants and 3 million in direct and indirect shares. The sale is noise, but the Q4 earnings miss underneath it is worth a closer look.

John Farahi sold 3,000 shares of Monarch Casino stock across two March transactions for a combined $295,430. The company has a $1.78 billion market cap. Farahi holds 536,304 shares directly, 2.5 million indirectly through trusts, and option grants covering another 6.67 million shares at exercise prices between $23.08 and $95.70. The sale represents 0.37% of his direct holdings.

This is not a story about insider confidence. This is a rounding error in a personal portfolio. A CEO making $3.66 million annually (79.5% of which comes in stock and options) liquidating $295K is tax planning, estate planning, or buying a boat. The filing is public because the SEC requires it. The financial press covers it because the algorithm flags it. Neither of those facts makes it meaningful.

The number worth watching isn't the 3,000 shares. It's Q4 2025 EPS: $1.25 versus the $1.37 consensus estimate. That's a 9% miss on the bottom line while revenue came in at $140 million, slightly above the $139.39 million estimate. Revenue up 4.1% year-over-year with a material earnings miss means cost pressure is eating into flow-through. That's the finding. Not the stock sale.

MCRI dropped 2.6% on March 30 on weakening consumer sentiment data. Analysts still have a "Moderate Buy" consensus with a $99.80 average target. Farahi sold his second tranche at $99.00... essentially at the analyst target. Another director, Paul Andrews, sold 6,100 options at $97.40 in February. Two insiders selling near the consensus price target in the same quarter is more pattern than coincidence. It doesn't mean they're bearish. It means they think the stock is fairly valued right now.

For anyone tracking regional gaming operators, the question is margin trajectory. Revenue growth with earnings compression at a two-property company (one in Reno, one in Black Hawk) suggests either labor costs, gaming mix, or promotional spending is moving in the wrong direction. That's worth a 10-K read when it files. The 3,000-share sale is not.

Operator's Take

Look... I know insider sale headlines feel like signal. They almost never are, especially at this scale. If you're an investor or asset manager watching regional gaming operators, ignore the stock sale and pull Monarch's Q4 detail. Revenue beat with an earnings miss means something is compressing margins at property level. Run the trend on their operating expenses against the 4.1% revenue growth and see where the gap opened. That's the story. A CEO selling one-third of one percent of his direct holdings tells you nothing about the business. A 9% EPS miss tells you plenty.

— Mike Storm, Founder & Editor
Read full analysis → ← Show less
Source: Google News: Casino Resorts
Wynn's Q4 Tells the Real Story: Revenue Up, Profits Down, and $10.5B in Debt

Wynn's Q4 Tells the Real Story: Revenue Up, Profits Down, and $10.5B in Debt

Wynn Resorts beat revenue expectations by $20 million and still missed EPS by over 20%. When top-line growth can't cover cost growth, the math is telling you something the CEO won't.

$1.87 billion in Q4 revenue, a $1.17 adjusted EPS against a $1.42 consensus. That's a 20.4% miss on the number that matters. Revenue grew 1.5% year-over-year. Operating expenses grew 8.3%. Net income dropped from $277 million to $100 million in the same quarter a year ago. Let's decompose this.

The Macau segment tells the clearest story. Operating revenue grew 4.4% to $967.7 million, but Adjusted Property EBITDAR dropped 7.5% to $270.9 million. Revenue up, profitability down. That's the treadmill. VIP hold percentages declined at both Macau properties, and management attributed the miss to "lower-than-expected hold" as if variance in hold is an unpredictable act of nature (it's not... it's a structural feature of VIP-dependent revenue, and if your earnings model can't absorb normal hold fluctuations, your earnings model is fragile). Las Vegas wasn't much better. Operating revenues down 1.6% to $688.1 million. ADR up 2.2%, but occupancy and RevPAR declined. They're getting more per room from fewer guests. That works until it doesn't.

Three things the earnings call didn't adequately quantify. First, the Encore Tower remodel starting Q2 2026 will remove approximately 80,000 available room nights from inventory. Management called it a "slight headwind." I'd want to see the RevPAR impact modeled against a comp set that isn't taking rooms offline. Second, total contributions to the UAE joint venture have reached $914.2 million for a 40% stake in a property that doesn't open until Q1 2027. That's dead capital until revenue starts flowing... and the revenue assumptions for an integrated resort in a market with no gaming track record are, generously, speculative. Third, the CFO is retiring before the Q2 earnings call. Losing your finance chief during a margin compression cycle and a major international development push is not a line item. But it should be.

The balance sheet carries $10.55 billion in debt. The company paid a $0.25 quarterly dividend. I've audited capital structures where the dividend signaled confidence. I've also audited structures where the dividend signaled "we can't cut it without triggering a sell-off." At current earnings trajectory, the interest coverage math deserves more scrutiny than the analyst calls are giving it. Wells Fargo trimmed its target to $147, UBS dropped to $146, and the stock fell 6.63% after hours. The market did the math faster than the narrative.

For REIT asset managers and institutional holders watching gaming-adjacent hospitality names, this quarter is a pattern worth flagging. Revenue growth that doesn't convert to margin improvement is a cost problem, a mix problem, or both. Wynn is dealing with both simultaneously... rising payroll and repair costs on the expense side, declining hold and occupancy on the revenue side. The UAE bet is a 2027-and-beyond story. The margin compression is a right-now story. Check again.

Operator's Take

Look... if you're an asset manager holding gaming-exposed hospitality assets, this quarter is your signal to stress-test every property in your portfolio against a scenario where revenue grows 1-2% but expenses grow 8%. Because that's not hypothetical anymore. That's what just happened to one of the best operators in the business. Run the numbers this week. If your coverage ratios get uncomfortable at those spreads, you need to be having the conversation with your lenders now, not after Q1 reports.

— Mike Storm, Founder & Editor
Read full analysis → ← Show less
Source: Google News: Wynn Resorts
End of Stories